A detective game about data literacy. The owl detective agency takes cases from an animal town: juice stand sales, library loans, pet surveys, monthly rainfall, park visitors, an ice cream shop's business, and more. All the data is made up by the game, so every round is different.
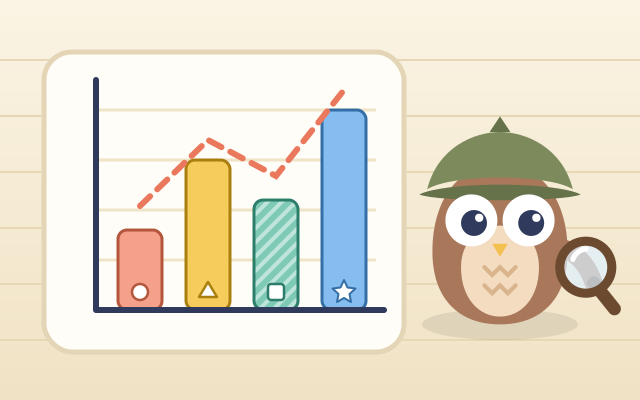
There is more than one way to play: tap the answer right on a bar chart, pictogram or line chart; move points on a dot plot until the mean, median or range matches the request; read a chart and stamp a statement "Supported", "Refuted" or "Can't tell"; and catch what a misleading chart has done, such as a vertical axis that doesn't start at 0, uneven scale steps, pictures scaled in width and height, a hand-picked stretch of time, skipped years, or a pie chart that doesn't add up to 100%. Spot it and the chart turns into a fixed version.
There are 5 chapters and 30 cases: reading charts, mean and median, what the data says, charts that mislead, and detective finals (choosing the right chart, double bar charts, head counts from pie charts). Every chapter also has endless random cases, and the game checks that every question has exactly one answer.
How to play
- Tap "Start a case" to pick up at the first unsolved case, or choose a chapter and case from "Cases". The first time you open a chapter, "Detective notes" explain its key ideas; the notes button at the top shows them again any time.
- Read the question at the top. When it says "Tap the answer on the chart", tap the bar, point, line segment or pie slice (the names beside a pie chart work too). When there are options, tap a button below.
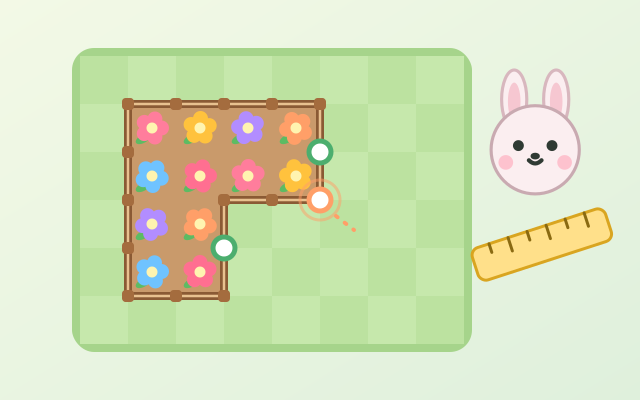
- Dot plot requests: tap a blue dot to select it, then move it with ‹ › or drag it sideways. You may move only as many dots as the request allows; moved dots turn orange and leave a dashed ring where they started, and "Undo" puts everything back. Early cases show the mean (triangle) and median (dashed line) live; later ones make you work them out. Tap "Close case!" to check.
- Judging questions: stamp "Supported" if the chart gives evidence for the statement and "Refuted" if the numbers contradict it. If it talks about causes, the future, people who weren't asked, or a head count when only percentages are given, stamp "Can't tell".
- Each case has 4 questions. All right first time with no hint earns 3 stars; 1–2 slips or hints earn 2, more earn 1. Solving 4 cases in a chapter opens the next.
Controls
- Phone / tablet: for reading questions, tap the bar, point, line segment or pie slice on the chart; for number and judging questions, tap the big buttons below; for misleading charts, tap the part that was tampered with (vertical axis, horizontal axis or the shapes). In dot plot requests, tap a dot, move it with ‹ › or drag it sideways, then tap "Close case!".
- Mouse: click and drag, just like touch.
- Keyboard: ← → choose on the chart (or move the selected dot), ↑ ↓ pick another dot, Enter confirm or go on, 1–4 answer, 1–3 stamp a verdict, H hint, M mute, Esc back to the cases.
For parents
- Designed mainly for ages 13 and up; 9 to 12-year-olds can start with chart reading in chapter 1. Bar, line and pie charts, mean, median and range are standard school statistics, while "correlation is not causation", "a small sample can't speak for everyone" and misleading charts are data literacy children meet every day in news and online. Moving data points by hand lets them see the mean shift like a seesaw's balance point when an outlier appears, while the median barely moves.
- All data, shops and numbers are made up; no real people, brands or current events are involved. Every misleading trick is explained next to a "fixed chart" once it is spotted, so the aim is to recognise tricks, not to use them.
- There is no time limit and there are no lives: a wrong answer only explains what is different, and the hint is always available, costing only stars. There is no chat, no in-app purchases, no ads, no outbound links and no online leaderboard, and no personal information is ever asked for. Stars, notes already read and the mute setting stay in this device's browser only, and the game works offline once loaded.